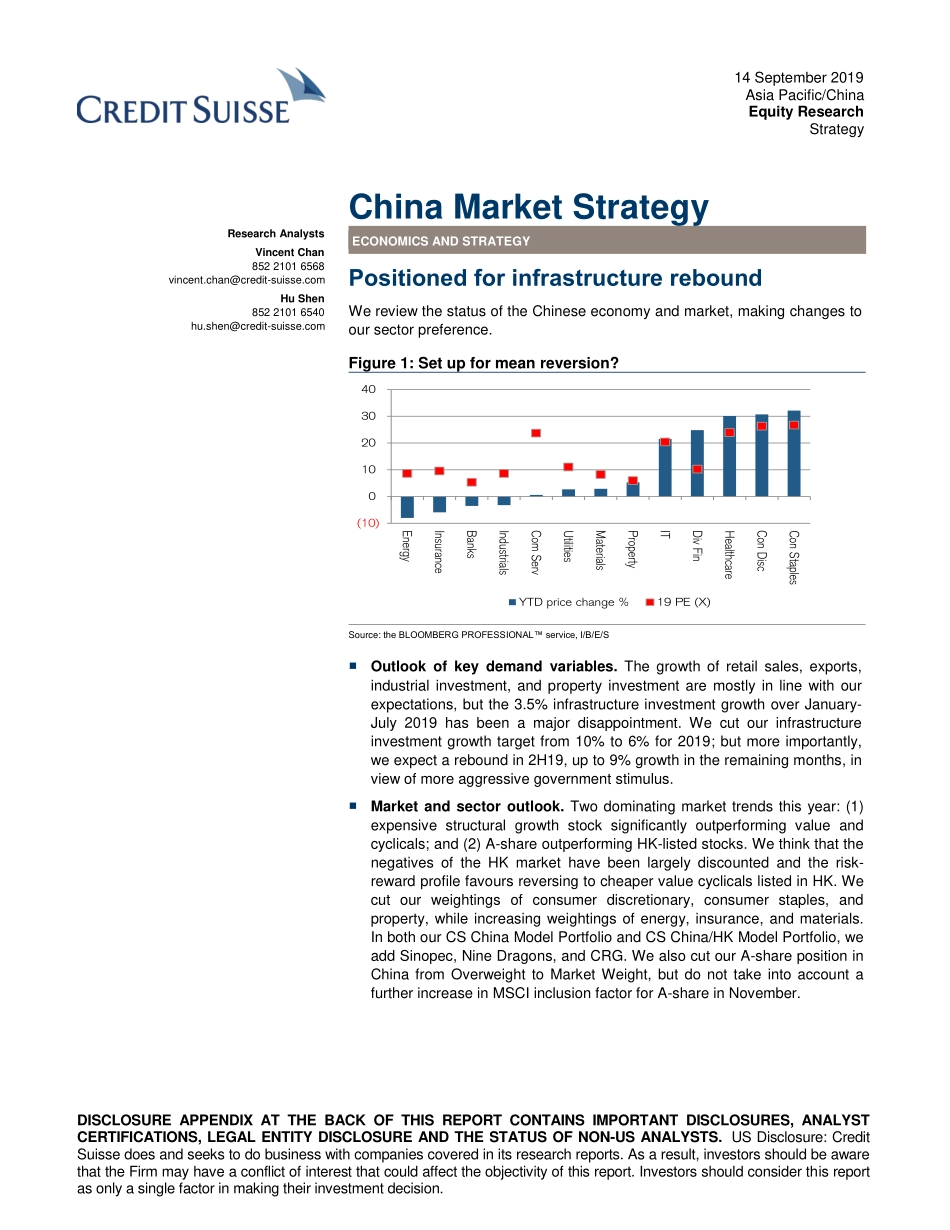
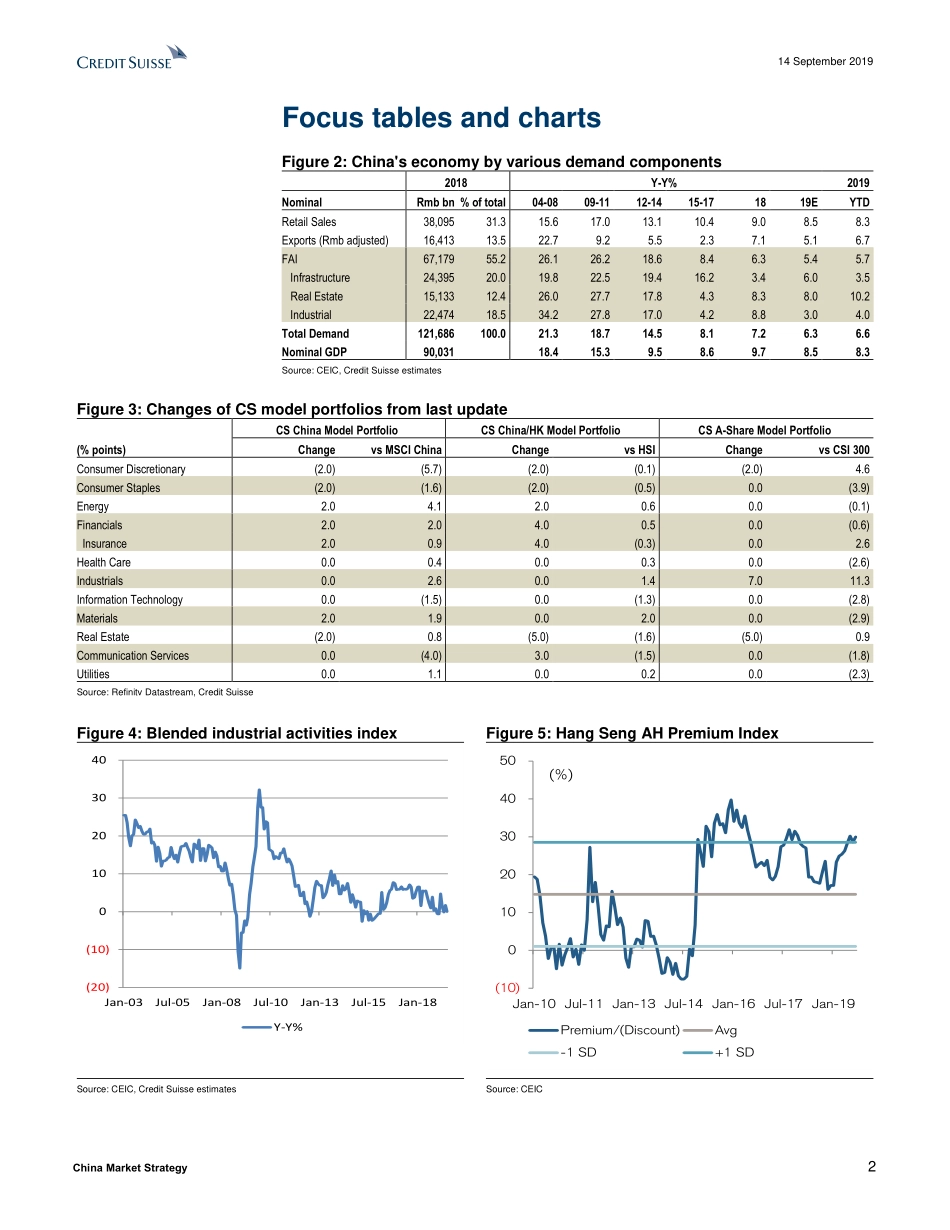
DISCLOSURE APPENDIX AT THE BACK OF THIS REPORT CONTAINS IMPORTANT DISCLOSURES, ANALYST CERTIFICATIONS, LEGAL ENTITY DISCLOSURE AND THE STATUS OF NON-US ANALYSTS. US Disclosure: Credit Suisse does and seeks to do business with companies covered in its research reports. As a result, investors should be aware that the Firm may have a conflict of interest that could affect the objectivity of this report. Investors should consider this report as only a single factor in making their investment decision. 14 September 2019 Asia Pacific/China Equity Research Strategy China Market Strategy Research Analysts Vincent Chan 852 2101 6568 vincent.chan@credit-suisse.com Hu Shen 852 2101 6540 hu.shen@credit-suisse.com ECONOMICS AND STRATEGY Positioned for infrastructure rebound We review the status of the Chinese economy and market, making changes to our sector preference. Figure 1: Set up for mean reversion? Source: the BLOOMBERG PROFESSIONAL™ service, I/B/E/S ■ Outlook of key demand variables. The growth of retail sales, exports, industrial investment, and property investment are mostly in line with our expectations, but the 3.5% infrastructure investment growth over January-July 2019 has been a major disappointment. We cut our infrastructure investment growth target from 10% to 6% for 2019; but more importantly, we expect a rebound in 2H19, up to 9% growth in the remaining months, in view of more aggressive government stimulus. ■ Market and sector outlook. Two dominating market trends this year: (1) expensive structural growth stock significantly outperforming value and cyclicals; and (2) A-share outperforming HK-listed stocks. We think that the negatives of the HK market have been largely discounted and the risk-reward profile favours reversing to cheaper value cyclicals listed in HK. We cut our weightings of consumer discretionary, consumer staples, and property, while increasing weightings of energy, insurance, and materials. In both our CS China Model Portfolio and CS China/HK Model Portfolio, we add Sinopec, Nine Dragons, and CRG. We also cut our A-share position in China from Overweight to Market Weight, but do not take into account a further increase in MSCI inclusion factor for A-share in November. (10)010203040EnergyInsuranceBanksIndustrialsCom ServUtilitiesMaterialsPropertyITDiv FinHealthcareCon DiscCon StaplesYTD price change %19 PE (X) 14 September 2019 China Market Strategy 2 Focus tables and charts Figure 2: China's economy by various demand components 2018 Y-Y% 2019 Nominal Rmb bn % of total 04-08 09-11 12-14 15-17 18 19E YTD Retail Sales 38,095 31.3 15.6 17.0 13.1 10.4 9.0 8.5 8.3 Exports (Rmb adjusted) 16,413 13.5 22.7 9.2 5.5 2.3 7.1 5.1 6.7 FAI 67,179 55.2 26.1 26.2 18.6 8.4 6.3 5.4 5.7 Infrastructure 24,395 20.0 19.8 22.5 19.4 16.2 3.4 6.0 3.5 Real Estate 15,133 12.4 26.0 27.7 17.8 4.3 8.3 8.0 10.2 Industrial 22,474 18.5 34.2 27.8...