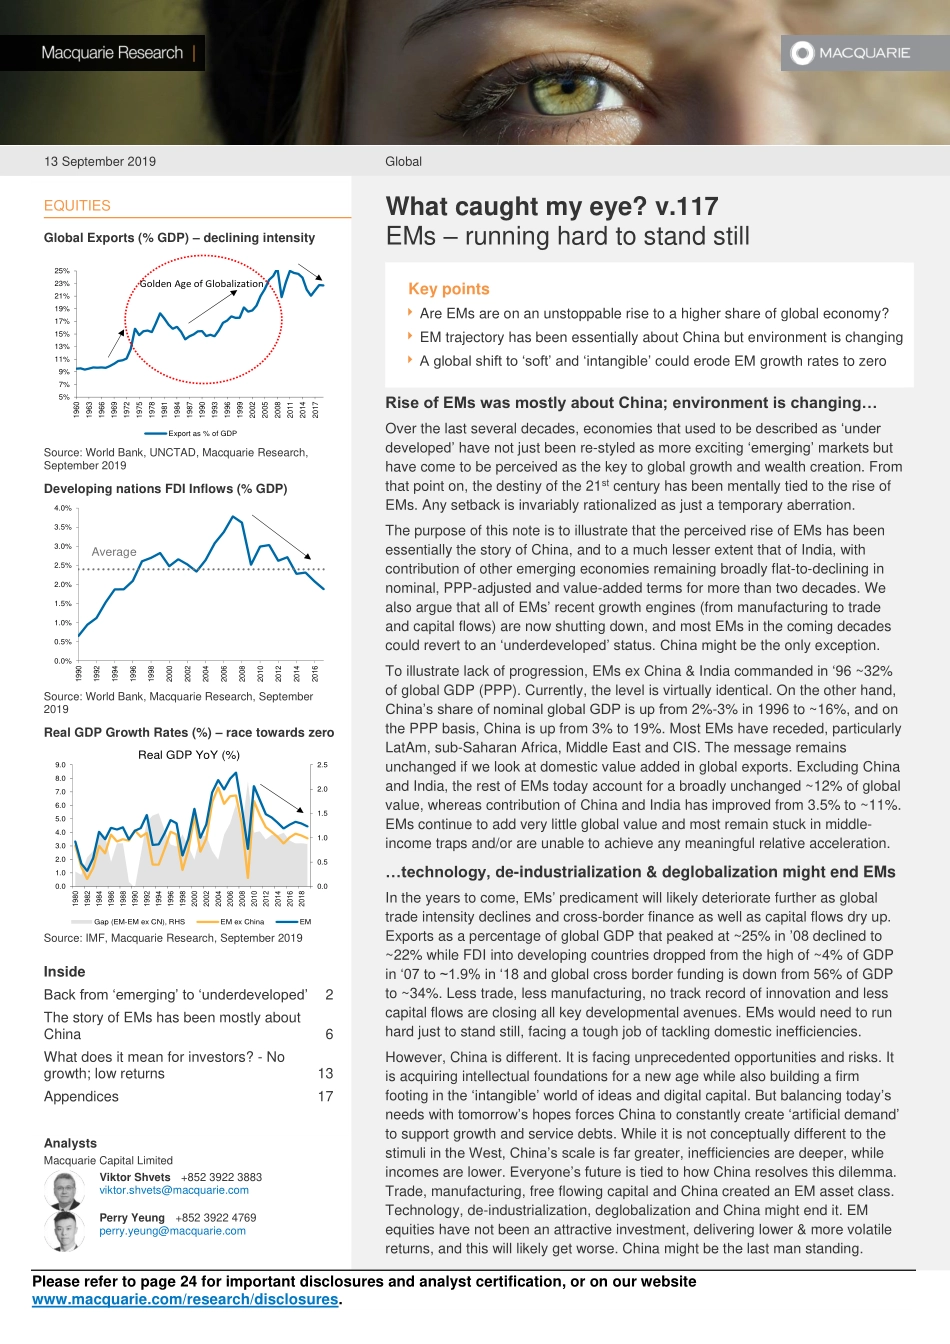
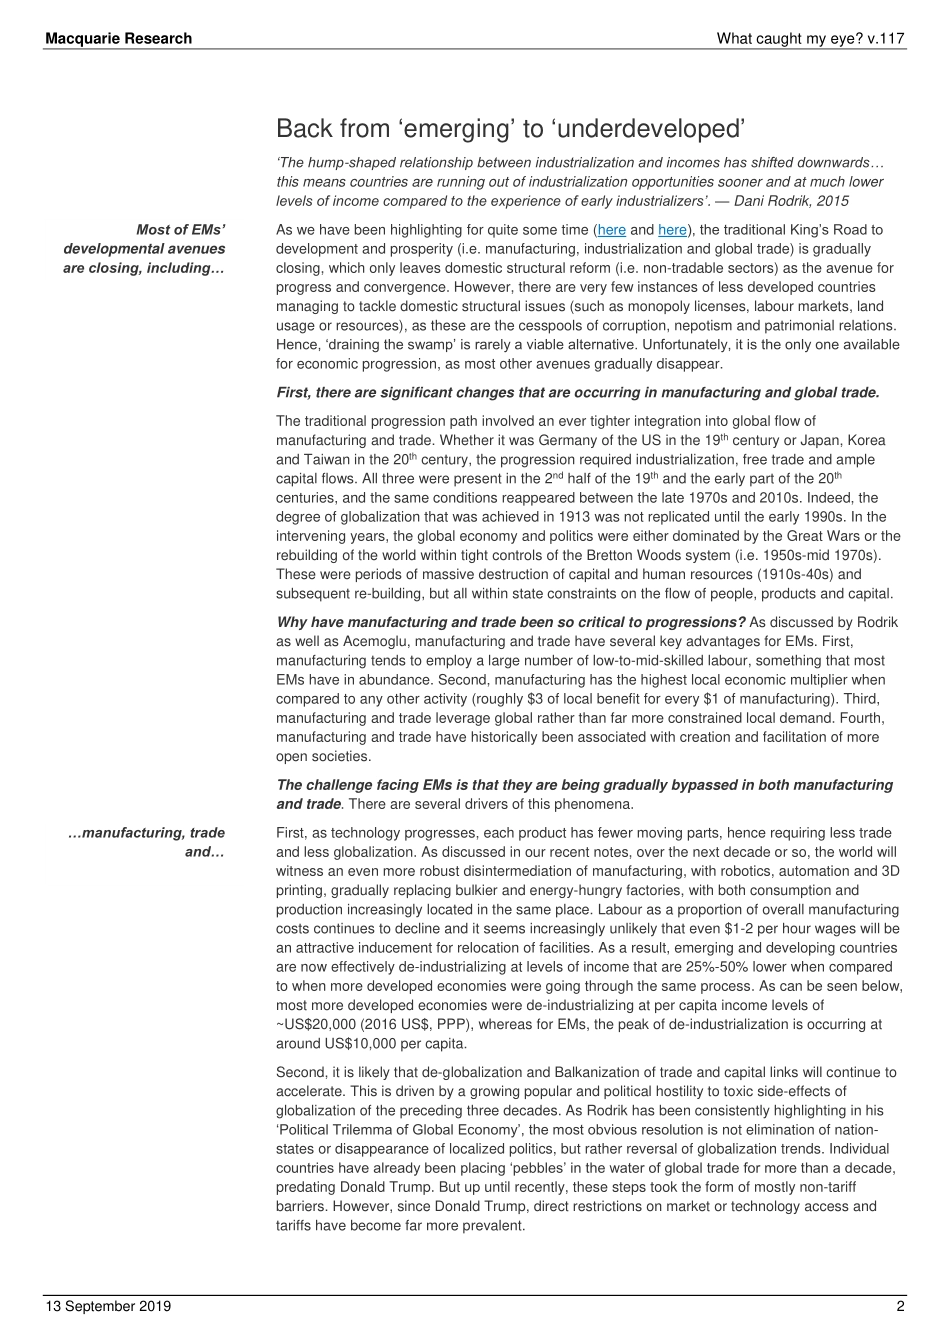
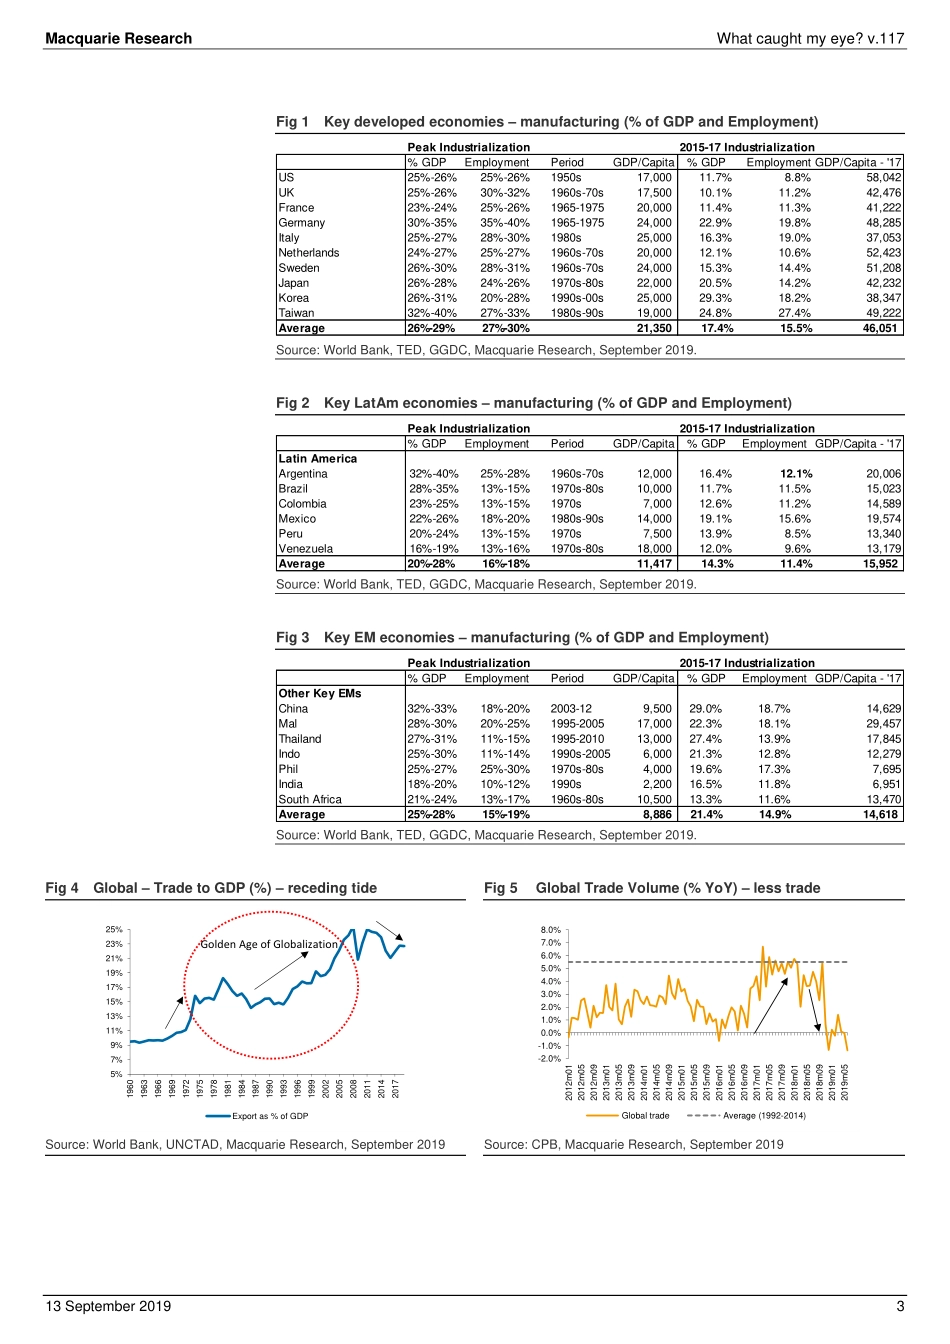
Please refer to page 24 for important disclosures and analyst certification, or on our website www.macquarie.com/research/disclosures. 13 September 2019 Global EQUITIES Global Exports (% GDP) – declining intensity Source: World Bank, UNCTAD, Macquarie Research, September 2019 Developing nations FDI Inflows (% GDP) Source: World Bank, Macquarie Research, September 2019 Real GDP Growth Rates (%) – race towards zero Source: IMF, Macquarie Research, September 2019 Inside Back from ‘emerging’ to ‘underdeveloped’ 2 The story of EMs has been mostly about China 6 What does it mean for investors? - No growth; low returns 13 Appendices 17 Analysts Macquarie Capital Limited Viktor Shvets +852 3922 3883 viktor.shvets@macquarie.com Perry Yeung +852 3922 4769 perry.yeung@macquarie.com What caught my eye? v.117 EMs – running hard to stand still Key points Are EMs are on an unstoppable rise to a higher share of global economy? EM trajectory has been essentially about China but environment is changing A global shift to ‘soft’ and ‘intangible’ could erode EM growth rates to zero Rise of EMs was mostly about China; environment is changing… Over the last several decades, economies that used to be described as ‘under developed’ have not just been re-styled as more exciting ‘emerging’ markets but have come to be perceived as the key to global growth and wealth creation. From that point on, the destiny of the 21st century has been mentally tied to the rise of EMs. Any setback is invariably rationalized as just a temporary aberration. The purpose of this note is to illustrate that the perceived rise of EMs has been essentially the story of China, and to a much lesser extent that of India, with contribution of other emerging economies remaining broadly flat-to-declining in nominal, PPP-adjusted and value-added terms for more than two decades. We also argue that all of EMs’ recent growth engines (from manufacturing to trade and capital flows) are now shutting down, and most EMs in the coming decades could revert to an ‘underdeveloped’ status. China might be the only exception. To illustrate lack of progression, EMs ex China & India commanded in ‘96 ~32% of global GDP (PPP). Currently, the level is virtually identical. On the other hand, China’s share of nominal global GDP is up from 2%-3% in 1996 to ~16%, and on the PPP basis, China is up from 3% to 19%. Most EMs have receded, particularly LatAm, sub-Saharan Africa, Middle East and CIS. The message remains unchanged if we look at domestic value added in global exports. Excluding China and India, the rest of EMs today account for a broadly unchanged ~12% of global value, whereas contribution of China and India has improved from 3.5% to ~11%. EMs continue to add very little global value and most remain stuck in middle-income traps and/or are unable to achieve an...