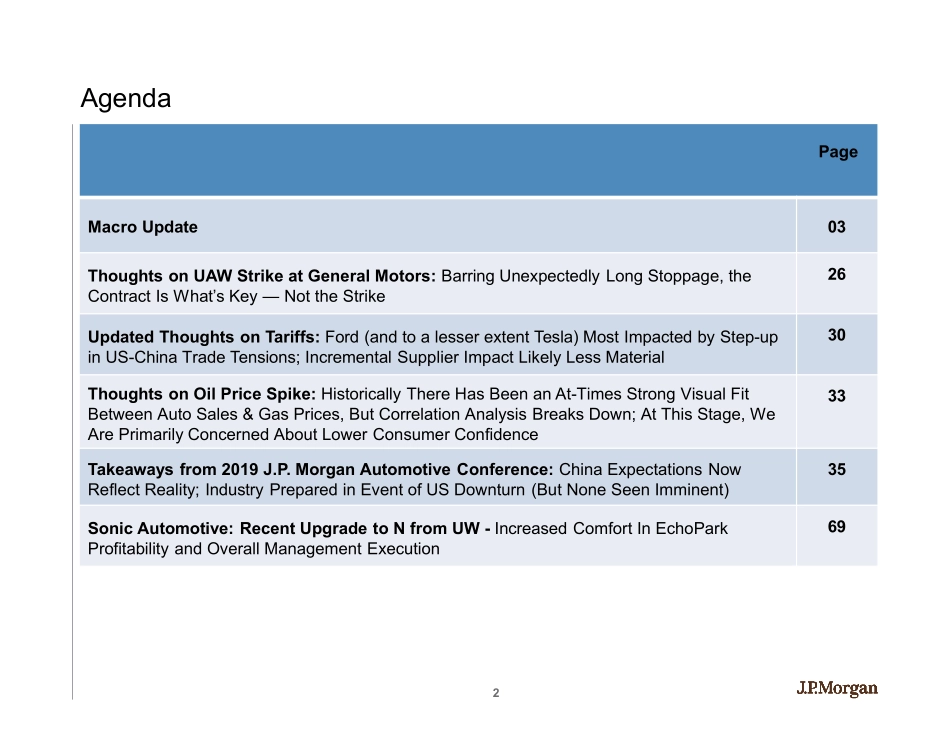
1State of the Auto IndustryThoughts on GM-UAW Strike, Oil Price Spike, & Increased US-China Trade Tensions; Takeaways from 2019 J.P. Morgan Auto Conference; SAH Upgrade to NeutralUS Autos – Equity Ryan Brinkman AC212-622-6581ryan.j.brinkman@jpmorgan.comJ.P. Morgan Securities LLCBloomberg JPMA BRINKMAN See the end pages of this presentation for analyst certification and important disclosures, including non-US analyst disclosures.J.P. Morgan does and seeks to do business with companies covered in its research reports. As a result, investors should be aware that the firm may have a conflict of interest that could affect the objectivity of this report. Investors should consider this report as only a single factor in making their investment decision. North America Equity ResearchSeptember 2019US Autos – Equity Rajat Gupta AC212-622-6382rajat.gupta@jpmorgan.comJ.P. Morgan Securities LLCBloomberg JPMA GUPTA 21Macro Update03Thoughts on UAW Strike at General Motors: Barring Unexpectedly Long Stoppage, the Contract Is What’s Key — Not the Strike26Updated Thoughts on Tariffs: Ford (and to a lesser extent Tesla) Most Impacted by Step-up in US-China Trade Tensions; Incremental Supplier Impact Likely Less Material30Thoughts on Oil Price Spike: Historically There Has Been an At-Times Strong Visual Fit Between Auto Sales & Gas Prices, But Correlation Analysis Breaks Down; At This Stage, We Are Primarily Concerned About Lower Consumer Confidence 33Takeaways from 2019 J.P. Morgan Automotive Conference: China Expectations Now Reflect Reality; Industry Prepared in Event of US Downturn (But None Seen Imminent)35Sonic Automotive: Recent Upgrade to N from UW - Increased Comfort In EchoPark Profitability and Overall Management Execution69AgendaPage3Macro Update4Global Light Vehicle SAARSource: Bureau of Economic Analysis, Ward’s Auto, LMC Automotive and J.P. Morgan estimates. Italicized numbers are estimates.U.S.W. EuropeJapanDevelopedMarketChinaBrazilRussiaIndiaBRICMarketCanadaMexico2017Jan17.314.75.037.028.01.81.33.434.5111123Feb17.314.65.136.928.92.01.53.435.8123118Mar16.814.75.136.626.72.31.63.534.1187137Apr16.813.45.535.725.41.91.63.832.7197114May16.814.55.536.826.12.41.63.633.6216123Jun16.814.45.536.728.12.41.73.035.2203127Jul16.713.55.035.229.62.01.54.337.4182122Aug16.514.55.436.328.92.51.54.337.1183125Sep18.114.25.237.431.02.31.74.139.0186116Oct17.914.04.936.830.42.31.73.537.9164123Nov17.514.65.137.129.62.31.73.737.3158141Dec17.314.35.236.829.71.91.63.536.81241592017 Average17.214.35.236.628.52.21.63.736.02,0341,5292018Jan17.115.35.137.528.52.21.73.936.3117109Feb16.914.95.036.928.22.31.93.836.2125109Mar17.214.15.036.328.92.41.93.937.1187118Apr17.214.45.637.230.72.71.84.239.4191109May17.214.85.437.530.02.41.94.438.6215114Jun17.214.65.237.028.92.41.84.237.3200120Jul16.714.75.236.628.32.41.64.236.5177114Aug16.618.45.440.428.22.71.54.136.5181119Sep17.411.35.033.726.62.51.83.934.8173114Oct17.512.65.535.626.22.91.73.734.5161117Nov17.413.35.536.325.32.52.03.833.6144134Dec17.612.85.035.425.82.21.93.633.61151422018 Avera...


