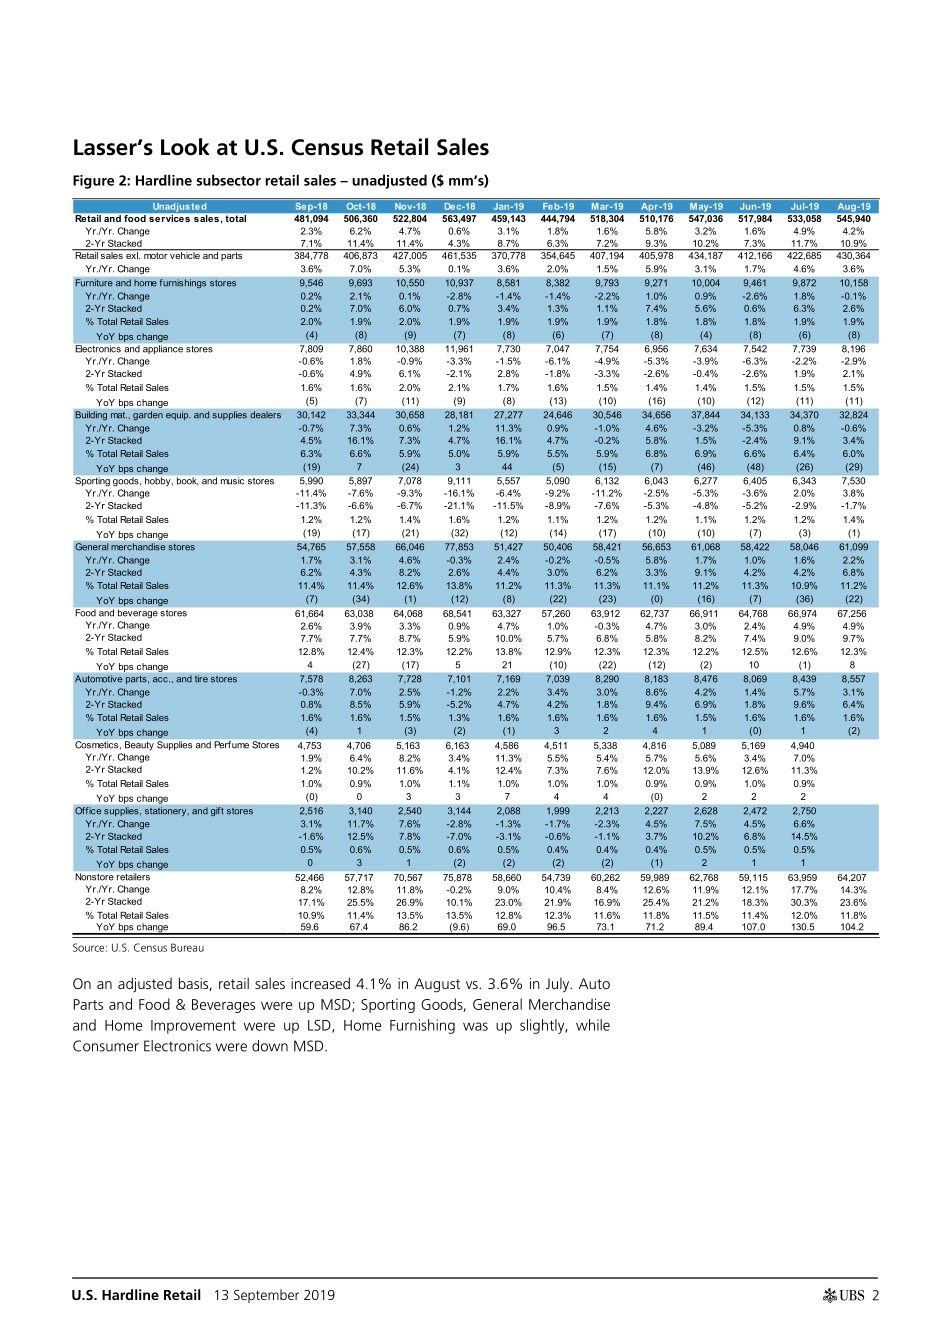
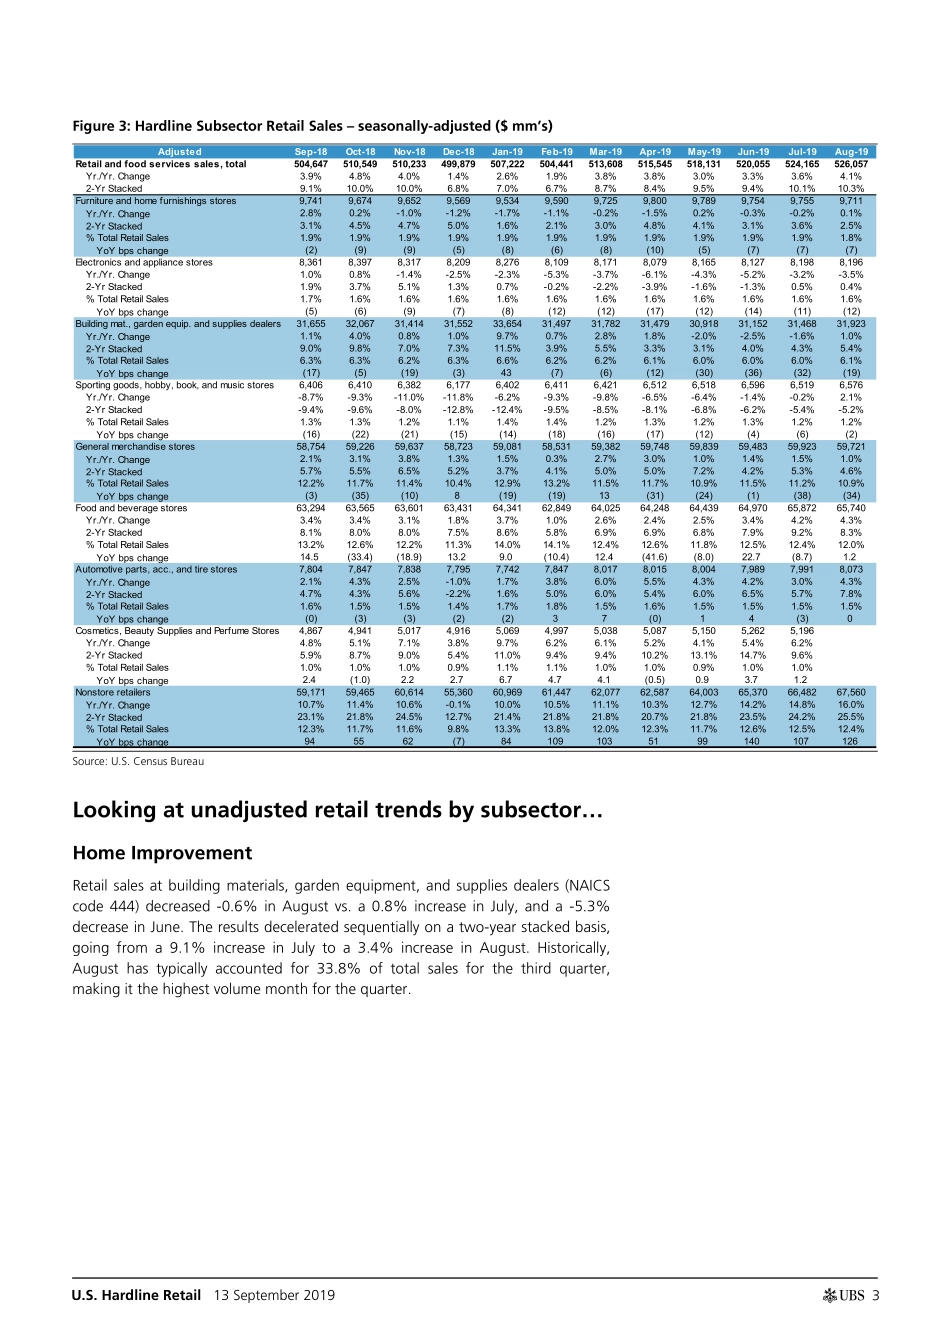
www.ubs.com/investmentresearch This report has been prepared by UBS Securities LLC. ANALYST CERTIFICATION AND REQUIRED DISCLOSURES BEGIN ON PAGE 19. UBS does and seeks to do business with companies covered in its research reports. As a result, investors should be aware that the firm may have a conflict of interest that could affect the objectivity of this report. Investors should consider this report as only a single factor in making their investment decision. Global Research 13 September 2019 U.S. Hardline Retail Lasser's Look at August 2019 U.S. Census Bureau Retail Sales Overall retail sales (unadjusted) increased 4.2% YoY in Aug (vs. 4.9% in July) The 2-yr stacked rate for retail sales was up 10.9% in August, a sequential deceleration of -80 bps. Adjusted sales grew 4.1% vs. 3.6% in July. The 2-yr adj. stack was 10.3% (vs. 10.1% in July). Non-store retail sales (~12% of overall retail sales in Aug) grew 14.3% (17.7% in July). Overall, a key takeaway is that total retail sales growth was up DD on a 2-yr stack for the 2nd consecutive month (on both unadjusted & adjusted bases). This shows spending growth remains robust despite tough compares. Notably, within Hardlines and Broadlines, trends varied meaningfully between sub-sectors. Home Improvement & CE declined; Home Furnishings was largely flat Home Improvement sales (NAICS 442) decreased -0.6% YoY in Aug vs. a 0.8% increase in July (2-yr stack decelerated -570 bps). Adj. was up 1.0% (vs. -1.6% in July). We believe lumber price deflation continued to weigh on the category (lumber yards are a piece of the category). Home Furnishings sales decreased -0.1% in Aug (vs. a 1.8% increase in July). Adj. was up 0.1% vs. -0.2% in July. CE sales decreased -2.9% (vs. -2.2% in July). Adj. was down -3.5% (down -3.2% in July). Gen Merch, F&B, and Auto Parts were all up Gen Merch (452) was up 2.2% in August (1.6% in July). The 2-yr was up 6.8% vs. 4.2% in July. Adj. was up 1.0% (1.5% in July). Food & Beverage stores increased 4.9% (in-line in July). Adj. grew 4.3%, vs. 4.2% in July. Auto Parts increased 3.1% in August (5.7% in July). Adj. was up 4.3% (3.0% in July). Sporting Goods & OS increased; Beauty was up MSD Sporting Goods increased 3.8% in Aug vs. a 2.0% increase in July. Cosmetics, Beauty Supplies, & Perfume (1-mo lag) increased 7.0% in July (vs. 3.4% in June). The 2-yr stack increased 11.3%. OS sales (1-mo lag) were up 6.6% in July (vs. 4.5% in June). Figure 1: Snapshot of U.S. Census Bureau Retail Sales Source: U.S. Census Bureau UnadjustedSep-18Oct-18Nov-18Dec-18Jan-19Feb-19Mar-19Apr-19May-19Jun-19Jul-19Aug-19Retail and food services sales, total481,094506,360522,804563,497459,143444,794518,304510,176547,036517,984533,058545,940Yr./Yr. Change2.3%6.2%4.7%0.6%3.1%1.8%1.6%5.8%3.2%1.6%4.9%4.2%2-Yr Stacked7.1%11.4%11.4%4.3%8.7%6.3%7.2%9.3%10.2%7.3%11.7%10.9%Retail sales exl. motor vehicl...